Tuesday, November 13, 2012

Student Spotlight: Special Topics in GIS - Web Mapping Project


GIS 4930 / 5935 Special Topics in GIS, Instructor, Mrs. Trisha Holtzclaw

This week we will be highlighting student’s work from the Special Topics in GIS: Web Mapping Project.

Web Mapping Project Highlights

Through this project students learned to create two types of Arc Online map products: interactive map presentations, and interactive web map applications. Presentations were created using the more advanced ArcGIS.com online mapping tool: ArcGIS Explorer Online. Web applications were made through the Arc Online map viewer. Students tailored stand-alone map products to provide more information than basic standard web map. They utilized these presentations to introduce users to their web mapping projects, and invited them to use your web map application and add to the dataset themselves.

Objectives:
  • Create an ArcGIS Explorer Online presentation
  • Create an ArcGIS Online web application
  • Embed interactive presentation into blog post
  • Completed Process Summary

Student Spotlight Awards

Please join us in congratulating Georgina Black. Her deliverables for the Web Mapping Project were exactly what we were looking for with this assignment.

Georgina Black
About Georgina: Georgina is currently working as a 1N171 or Geospatial Intelligence Analyst and working 48 hours per week. She exploits radar, infrared, multi-spectral, and wet film imagery from airborne assets, full motion electro-optical and infrared imagery and multi-spectral, infrared and electro-optical satellite imagery. Georgina is also quality control for the intelligence products generated from these sensor types. She would describe herself as a vector but specifically, the one created by Network Analyst. She finds two or more folks or ideas and determines the shortest path between them for optimal learning and growing for everyone involved. Connecting dots efficiently, that is Georgina. Welcome to the spotlight Gina!

What we like:  Georgina’s presentation was visually compelling. Her text instructions were clear and her pop-up images and zoom extent was excellent. Links were a tricky part of the assignment this week, but Georgina managed to complete everything without issue. Great job this week, Georgina. Enjoy your time in the spotlight!


View Larger Map

Monday, November 12, 2012

Student Spotlights: Photo Interpretation and Remote Sensing - Module 7


GIS4035 Photo Interpretation and Remote Sensing, Instructor, Mr. Brian Fulfrost

This week we will be highlighting student’s work from the Remote Sensing Course's Module 7: Multispectral Analysis Lab

Multispectral Analysis Project Highlights

For this laboratory exercise students examined an image of forest surrounding the Olympic Mountains in Washington State.  They learned the different bands – or layers – of satellite imagery to use to best study various images.  They also learned to calculate an index that allowed them to easily distinguish between vegetation and other features within the photo. 


Objectives:
  • Explore Image Histograms
  • Operate the Inquire Cursor
  • Interpret histogram data in images
  • Identify features by interpreting digital data

Student Spotlight Awards

Please join us in congratulating David Doffing and Mohammed Hussain. Their deliverables for the Multispectral Analysis Lab were exactly what we were looking for with this assignment.

David Doffing


About David: David resides in the lovely city of Golden, Colorado. He received his Bachelors in Computer Science from Fort Lewis College in Durango, Colorado. David was introduced to GIS by his step-father and currently works as a Data Technician at Axess Communications. In his free time David likes to snowboard, skateboard, hike, and play guitar. All of your hard work has paid off, David. Enjoy your time in the spotlight!


What we like:  David’s maps were visually compelling. Clearly distinguished bands were utilized in the legend creating an apparent understanding of what was being viewed. Overall, his project demonstrated understanding of concepts and techniques learned in the module assignment.


Mohamed Hussain
About Mohamed: Mohamed received his Bachelors in surveying engineering in 2003. His hope is that the UWF Online GIS program will help to improve his GIS skills so that he can change his career path to a more GIS related field. Based on the work he’s demonstrated this week we think he is right on target Congratulations and welcome to the spotlight!

What we like: He did a great job of outlining the steps used to identify the features directly in maps. His methods used are clearly demonstrated in the image shown. He displays a keen understanding of the concepts and techniques learned in the lab assignment.


Monday, November 5, 2012

Student Spotlights: Special Topics in GIS in Archaeology


This week we will be highlighting student’s work from the Special Topics in GIS for Archaeology Course's Scythian Burial Mounds Project. 

Scythian Burial Mounds Project Highlights

Who are the Scythians? The Scythians were a group of culturally similar nomadic, horse-riding pastoralists who inhabited a vast area ranging from central Asia and Russia to Romania and the Ukraine and north of the Black Sea between the 8th century B.C. and the 2nd century A.D. This project presented to students the skills of combining information about a past culture and location in order to model the spatial relationship between archaeological sites and their surrounding landscape. First, students identified and collected data necessary for modeling spatial relationships of archaeological sites. Next, students referenced and implemented predictive modeling tools. Finally, students ran a regression analysis on their data and created a report based on the interpretation of their statistical results.

Objectives:
  • Run a regression analysis on the Scythian data
  • Interpret statistical results
  • Express predictions statistically via written report

Student Spotlight Awards

Please join us in congratulating Angela Matusik. Her deliverables for the Scythian Report Week were exactly what we were looking for with this assignment.

Angela Matusik

About Angela: Angela received her traditional GIS Certificate in Spring 2012 and returned to the program this Summer and Fall to add the Archaeology certificate to her list of accomplishments. In addition to taking courses in the Online GIS Program, Angela is a student in the online Maritime Studies program at the University of West Florida. She currently resides on a navy base in the Bahamas where she works full time as a civilian contractor for the Environmental, Health, and Safety Department. She dreams of one day working for the Department of Interior doing a combination of GIS and archaeology and/or environmental protection type work. Based on the skills she’s demonstrated in the program thus far, we’re confident Angela will one day make that dream a reality. Great work this week, Angela! We hope you enjoy your time in the spotlight!

What we like: Excellent cartographic skills! Angela carefully planned out the layout and design of her map making certain to present the data frames as well as the graph in a way that was visually pleasing. She diligently included all of her essential map elements as well as an inset to help demonstrate the exact location of the study area. Great job of "owning" your map!      

Angela Matusik's Scythian Report Document
  

Thursday, October 18, 2012

Photo Interpretation and Remote Sensing Student Spotlights...


This week we will be highlighting student’s work from the Remote Sensing Course's Ground Truthing and Accuracy Assessment Project. 

Ground Truthing and Accuracy Assessment Project Highlights

What is ground truthing?  It entails visiting a site to verify attributes located at a given location. First, students determined the locations on the map to be ground truthed (i.e. sample). Next, they “travel” to those locations on Google Maps to determine the true Land Use Land Cover (LULC) of each location using the same list and level of LULC classified in a previous lab. If the street view indicates the same LULC as your map’s classification, that spot is marked as true. If the location is found to have a different use or cover, mark it as false. Once all the locations have been checked, students use the ratio of “true” results to the total number checked to determine the percent accuracy of the classification.

Objectives:
  • Construct an unbiased sampling system
  • Locate and identify features using Google Maps street view
  • Calculate the accuracy of a Land Use/Land Cover classification map

Please join us in congratulating David Jenness and Joshua Harding. Their deliverables for the Ground Truthing Project were exactly what we were looking for with this assignment.

Student Spotlight Awards

David Jenesses:

About David: David works for the Suwanee River Water Management District in Live Oak, Florida in the IT department.  He completed his GIS internship earlier this year and has a career goal becoming a GIS programmer.  We hope you enjoy your time in the spotlight!


What we like: Excellent cartographic skills!  David was careful to include comprehensive land use and land cover throughout the study area, used complementing colors to distinguish types and also had a high percentage of accuracy.  Great job of "owning" your map! 


About Josh: Josh is a graduate of the University of Florida and is currently interning at Alachua County Habitat for Humanity office in Gainesville, Florida. Josh would describe himself as a raster because sometimes he can be pixelated and rigid and then other times I can be a hi-res smooth dude.  Nice!  Welcome to the spotlight Josh, unpack and stay awhile.  
What we like: 
Clear depiction of ground truthing locations and accuracy.  Excellent map layout!   


Friday, September 28, 2012

Project 1: Student Spotlights...

Hello students,

I am happy to announce the return of Student Spotlights. This semester we have decided to post the work of students that we feel did a tremendous job on the entire project.  We will also be including a tidbit about the student’s internship location.  This first go-around we will be highlighting student’s work from the Special Topics in GIS Course, Project I - Statistical Analysis of Methamphetamine Labs  - Location: Charleston West Virginia.

Please join me in congratulating Katherine Michael and Adriano Baptista. Their reports for this first project were precisely the caliber of work that we were looking for with this assignment. Both had a wonderful report format and thoroughly explained their results of the analysis. Each student’s discussion points for this project were slightly different; however, Katherine and Adriano did an exemplary job of discussing possible reasons their analysis turned out the way it did.

This project was definitely one to get you thinking. Great job everyone!

Be sure to check below to see Katherine and Adriano’s reports:

Adriano Baptista:

Adriano is part of our ESRI Virtual Campus Group in GIS Internship.   When not plugging away at the assigned courses, you can find him working with a European Union agency that supports the decision–making of the EU in the field of the Common Foreign and Security Policy, by providing IMINT/GEOINT products resulting from the analysis of satellite and aerial imagery.  This sounds like very exciting work and highly technical.  Adriano is currently living in Portugal and loves to go diving. He describes himself as a raster because he is “what you see is what you get!” person.  Great job Adriano and welcome to the spotlight!


Katherine Michael:
Katherine is working with the Putnam County, FL, GIS team.  An exciting part of her new job will be learning how to operate in the SDE environment as opposed to using personal and file geodatabases. Katherine is a mom and photographer, and would describe herself as a raster because she is colorful and highly detail oriented. Excellent work Katherine and we hope you enjoy your time in the spotlight!


Tuesday, September 11, 2012

Fall and Final Semester Welcome

Students and Guests, Welcome to the Online GIS Certificate Program blog!  Students are beginning the last semester of the Certificate program.  Expect to see our student's best work debuted here each week.  Visit often to view student spotlights and insight to GIS at UWF!

Fall Courses/Descriptions:


Special Topics in GIS (GIS4930/5935) Instructor, Trisha Holtzclaw

Special Topics in GIS for Archaeology (GIS4990/5990) Instructor, Scott Palumbo, PhD

GIS Internship (GIS4944/5945) Instructor,  Leah Lewis

Photo Interpretation and Remote Sensing (GIS4035/L) Instructor, Brian Fulfrost


Tuesday, July 3, 2012

GIS Applications for Archaeology: Student Spotlights

GIS4990/5990 GIS Applications for Archaeology

Ethics Hands-On Exercise Highlights

As stewards of the past, it is our responsibility to ensure sensitive archaeological data is protected, and priceless, irreplaceable aspects of our human history are not lost through careless data management. In this assignment, students focus on the issues surrounding archaeological site preservation and data security. In addition to managing and securing data, students learn more about tools to assist further applications of archaeological GIS. Our subject of study is the database developed by the Getty museum for management and condition assessment of the archaeological sites in Jordan. Students learn about the database as a model for many currently in use for site management and analysis, and we use it as an example for our own research.

Objectives:

  • Identify data security and management concerns
  • Correctly manage files in a secure geodatabase and file structure
  • Digitize features as layers in a secure directory
  • Recognize current efforts to create condition assessment databases for monitoring archaeological sites, and preventing further destruction of cultural resources.
  • Discuss their ethical obligations at professional archaeologists.

This week's student spotlight awards go to....

Maureen Mahoney

Maureen works as an archaeologist for the Seminole Tribe and lives in Bonita Springs, FL. Originally from Ohio, she went to undergrad in Indiana and grad school at Florida State.

What we like: Clever use of embedded map frame to illustrate the study area and cover up otherwise 'empty' map space. We applaud Maureen's attention to the site labels, giving them a white background really makes them stand out against an arid image and thus calls attention to the central objective of the map itself.

More: See Maureen's blog!


Jennifer Tryggestad

Jenny currently resides in New Jersey and manages the processing department for a marine geophysical company. She’s working on her GIS certificate to update her skills from college

What we like: We really like Jennifer's use of an embedded map frame here. This cleverly covers what would otherwise be an 'empty' area of map.

More: See Jenny's blog!


Thursday, June 28, 2012

Applications in GIS: Student Spotlights

GIS4048/5100 Applications in GIS 

In the Applications in GIS course, students begin the semester by working through a series of modules related to natural hazards. This week’s topic, earthquakes, is the first of three Geo-Hazards or Natural Hazards we cover (2nd hurricanes, 3rd tsunamis).  In each lesson, students learn how GIS is used to identify and plan, mitigate, prepare, respond and recover from a natural hazard.  Key terms are defined, and hands-on exercises  demonstrate GIS being used in real-world emergency scenarios.

Earthquakes Hands-on Exercise Highlights

Topics covered: Northridge temblor of 1994 (magnitude 6.7) near Los Angeles, CA. See exactly how GIS was used to organize the chaos that followed this event. Exercises use actual data collected and employed at the time of the quake. Analyze data and create maps similar to those used in the actual
response and recovery efforts.

Objectives:
  • Use GIS to identify features at risk from an earthquake.
  • Explain how geology and magnitude values relate to building damage.
  • Map building damage to reveal the configuration of a fault.
  • Import data from an earthquake catalog and visualize it in 3D.
  • Create summary tables and plot earthquake data as graphs.

Student Spotlight Awards

The following students were chosen for their exceptional work on the Northridge Temblor Earthquake assignment:


John Kearney

John is most interested in  GIS applications for wildfires. He is currently employed as a wildland firefighter/ Forest Ranger for the Florida Forest Service. He has GIS experience working at the University of Central Florida Arboretum; where he used GIS to help manage the 800 acres of natural lands. We appreciate  what you do inside and outside of class, John!  It's your time to shine.

What we Like: John created a very visually pleasing and easily understandable map document. He paid attention to detail by including the units for each scale within his legend. His map design was also very well laid out and easy on the eyes. 


More: See John's blog


Alison Hayden 

Alison works in the Marine Fisheries field and she is most interested in learning more about how GIS is used in this industry. In the past, Alison has contributed to research on a NOAA based study involving Juvenile swordfish in the Gulf of Mexico where essential habitat is defined. Specifically, she participated in an icthyoplankton study collecting the data to support NOAA research. In the ESRI list of GIS industries, Fisheries management falls within the Marine and Oceans under the Natural Resources group.  We think that's really cool! See her post to learn more. We enjoy Alison's work and I'm pleased to showcase her in this week's spotlight awards.

What we like: Allison did an excellent job at presenting her results in a clear and concise way. She went the extra mile by clearly identifying the specific levels in the legend on her map. Her insert map also helped to further identify exactly where the area of interest is.

More: See Alison'
s blog


Lorraine Huron

 Lorraine plans to continue her GIS studies with a master's degree and work in academic research.  Lorraine's dedication to academics shows in her work and I'm excited to include her in this week's line-up. Welcome to the spotlight this week, Lorraine!  

What we Like: Lorraine did a very nice job of incorporating her graphs into the layout. This provided the viewer with  in-depth information on the magnitude of the earthquakes. Her layout provides multiple layers of information in one simply comprised deliverable.  Great job, Lorraine!

More: See Lorraine's blog


Monday, April 23, 2012

Week 11: Georeferencing Student Spotlights

Georeferencing Lab Overview: 

In previous labs, students found, obtained, and viewed several types of GIS dataset formats. Each of these datasets had been created by someone specifically for a GIS system complete with geographically referenced coordinate data built in to the file. This is why, when you add data to ArcMap, it (usually) lines up properly automatically. The Georeferencing lab teaches students a method of adding this geographic referencing to a dataset (georeferencing), and how to create some types of new geographic data.

Objectives:

  • Utilize ArcGIS tools to georeference aerial photographs
  • Demonstrate the Editing skills learned last week
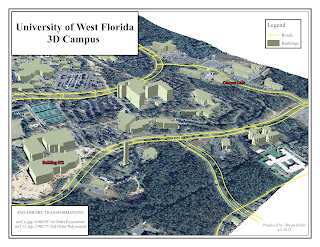
  • Discover ArcScene and produce a 3D map

Congratulations to this week's Student Spotlights!

Jennifer Tryggestad 

Jennifer currently lives in New Jersey and works for an ocean surveying company. She is a new mom and hopes that by obtaining her GIS certificate she can travel less
and manage more. We hear ya!
What we like: Very nice map design and nice building labels.
More:  see Jenny's blog

Sandie Vechio 


Sandi lives in Arizona and has a BA degree in Advertising/Journalism.  She chose the GIS program help her re-enter the work force since her children are in high school.  Her interests include GIS in real estate and demographics.  Just you wait – Sandi.  Applications and Internship are full of information.  Great job!  
What we like: Clean and well laid out map.
More:  see Sandie's blog


Bryan Hollis


Bryan is a New Hampshire native and spent a year working on an off shore oil rig in the Gulf of Mexico.  He’s back on land and utilizing GIS on a daily basis at his current position.  Bryan has never had an official GIS training, but he is doing a great job so far.  Check out his 3D model!

What we like: Very nice map - we like the view, colors and labels.
More: see Bryan's blog


Christopher Mullins

Chris just finished nine years of active duty with the Navy and currently lives in Augusta, GA where he works as an intel analyst contracting for the government.  He has always been interested in the GIS aspect of the intel community and getting a GIS certificate would definitely help his career progression.  He’s the proud dad of a toddler and is doing a great job balancing work, the program, and his little girl.  Awesome job Chris!

What we like: One of his best, we like the color choices and how easy details read.
More: see Christopher's blog

Michael Supranowicz

Mike lives in Chesire, Massachustets with his wife and cat.  He works for the chamber of commerce and is excited about the endless possibilities of GIS and business development.  Awesome job this semester Mike!


What we like: Nice angle/view and map layout!
More:  see Mike's blog

Friday, April 20, 2012

Week 10 Data Editing Student Spotlights

This week, learned how to modify existing data and create new features in an existing dataset. These Editing Sessions are powerful tools in GIS, and a bulk of the day-to-day work of GIS professionals.

Exercise Objectives:
  • Merge two parcels into one feature
  • Select parcels based on certain criteria
  • Update a road feature’s geometry to match surroundings
  • Digitize a new road feature
  • Create map of up-to-date features

Cograts to this week's Student Spotlights!


Roger Huron 

Roger recently completed the US Marine Corps and is currently employed by the United States Department of Justice.  He became interested in GIS after his wife (a geography major) took a GIS class.  Welcome to the spotlight, Roger! 

What we like: Really detailed map design. Data frames are a nice touch.
More: see Roger's blog.

.

Kira Kefer

 
Kira lives in Idaho and works as a staff assistant for an engineering consulting firm.  She chose the GIS Certificate as a way to enhance her career.  When not at her computer, Kira enjoys outdoor activities like fishing and bow hunting.  Oh, and don’t forget about hockey – Go Sun Valley Suns!

What we like: Really nice map inset and good use of symbology tools.
More: see Kira's blog


Collier Kidd 

Collier is from a small town in SW Georgia and works as a forestry technician in Albany, Georgia.  He is on the road to obtaining his GISP certification and is the proud dad of an almost two year old.  Great job this semester, Collier! 

What we like: One of Collier's best maps this semester. Easy to interpret map.
More: see Collier's blog.


Gabrielle Johnson 

Gabby is a senior here at UWF majoring in Environmental Studies.  She lives in Ft. Walton Beach and when not at school or mastering GIS at home, she can be found with her daughter Bella or at the beach.  Anyone with a coastal GIS project? – Gabby is your answer.  Nice job!

What we like: This is her best map this semester!
More: see Gabby's blog.

Robert Josey


What we like: Nice placement of data and color choices. Map layout is clean.
More:  see Robert's blog.


John Kearney 

 John lives in Perry, Florida with his wife and is employed as a fire fighter/ forest ranger for the Florida Forestry Service.  He is a graduate of UCF (University of Central Florida) and became interested in GIS while managing over 800 acres of land.  Awesome job in the program and for the environment!  We appreciate all that you do! 

What we like: Really nice design and layout
More:   see John's blog.

Sunday, April 15, 2012

Week 9 Vector Part II Student Spotlights

Did we skip a week? Yes, we did. Since students didn't create a visual output with Vector Part I and skills learned in Part I lead to Part II... decided to wait.

In Vector Part II, students completed the following objectives to create a final output the following students executed superbly.

Exercise Objectives:
  • Create a simple buffer around road features
  • Create a variable distance buffer around water features
  • Run the buffer tool using ArcPython
  • Run the overlay tool to combine or exclude multiple features
  • Distinguish and convert between multipart and singlepart layers
  • Find potential sites for a new campground

Alison Hayden 

Alison is a (recently retired) pro-triathlete of 16 years and a Marine Biologist/Oceanographer who has spent most of her career working in the field and mostly within the Gulf of Mexico."I am pursuing GIS in hopes of making my career as a Marine Biologist more practical." In her spare time, she loves traveling to exotic places, playing in the ocean and enjoys many types of exercise.

What we like:  Map layout - gray background makes information "pop."
More: See Alison's blog

Allen McLaughlin  

Allen is currently finishing up a double bachelors degree in Maritime Studies and Environmental Science.  Allen has an intense background in mapping, terrain modeling, and navigation he learned and used in the U.S. Army.  "I've used everything from dirt, sticks, string, hand grenade pins, bullets, parachute canvas, food, and even spit to create terrain models and field expedient maps in order to survive."  Allen plans on gaining a good working knowledge with ArcGIS in hopes to one day changing careers  to one involving the use of GIS.


What we like: Clean and easy to interpret map. Good color choices. Notes section including relevant art.

 More: See his Vector 2 blog post


Georgia Mass 

Georgia is new to GIS, but you wouldn't think it from the high-caliber of work she produces on a weekly basis!  When she isn't occupied with course work, Georgia stays busy as a Navy wife with 4 children.


What we like
: What a fun map! Good choice of colors, nice layout and  road labels are a bonus. 
More: See Georgia's blog


Karen Matthews

Meet Karen: "When I'm not the single mom to my 13 yr. old daughter, I'm a GA attorney doing real estate.  The real estate closing business has really changed in the last 5 years. We have gone from office closings to home closings. In the last 5 years, I've completed over 2700 transactions, burned up 2 cars and 400k miles. I'm ready for a real change." Karen is increasing her skill set with GIS to better serve her clients and to increase her marketability. Being new to GIS,  Karen has done an exceptional job picking up on the science and software in these past few months.  I'm excited to see what she can accomplish in this program with the basics under her belt.
What we like: Nice map layout, colors are easy on the eye with the main focus of campsites made obvious with a strong color, inclusion of conservation sites a bonus. 
More: See Karen's blog.


Katherine Michael

Welcome back, Katherine! Katherine does exceptional work in this class and with GIS. If you aren't following her blog - please do.

What we like:  Clean map design, layout and color choices (something Katherine executes well with all of her maps). Shadow effect on legend, data frame and notes section.


More: See Katherine's' blog

Ross Wachendorf 

 Ross moved Texas to become a Geographic Analyst for Nokia (formally Navteq) a little over a year ago. "We use our own propriety software and methods of operation, which is why I am taking this coarse in order to learn industry standard GIS methods." For a bit of background, Ross started working with Nokia three years ago driving data collection vehicles throughout the U.S. collecting street level images - cool! 
What we like: Colors, hill shading, simple map layout and road labels are a bonus. 
More: See Ross' blog.

Monday, April 9, 2012

Week 7 Data Search Student Spotlights

In this lab, students were required to download data from three online sources and to create 1-3 maps that best represent the data on their own with little instruction. Defining a common projection, getting all data layers to "fit" and determining the best way to present the data were no doubt the biggest obstacles students faced. All of our students did great job tackling this project and the following students excelled. 

Congrats to this week's Student Spotlights!


Alex Fowlkes  


 Alex impresses us on a weekly basis with his work.  This is his second time making the spotlight and it's well deserved. Take a look at his blog to see why.
 
What we like: Excellent map design... glowing even.


M. Magdy Hussain

Magdy produces great work consistently.  You'll find his maps to be accurate, clean and easy to interpret. Yes, this means if you aren't already following his blog, you definitely should. Welcome back, Magdy!

What we like: Magdy probably split the data over three maps the best of all. Data is presented clearly.  Labels and legends are easy to view as well. As Tanya put it, superb.


Shane Smith

Shane is another one of our students who produces excellent maps on a weekly basis. If you aren't already following his blog - yup, you should. Welcome back, Shane!  

What we like: We really like the map layouts in this series. The colors and placement of elements are well chosen and balanced. This particular map has great detail.


Shannon Riley


Shannon is a Government Emergency Specialist, a Command Post Controller with the Air Force and a mom. She's used GIS to map national security incidents and weather phenomena to provide situational awareness to key military personnel. I'm excited to include Shannon in this week's student spotlight line-up.


What we like: Easy to interpret maps with everything we were looking for. I like that Shannon chose to use classic black and white for elevation in Suwanee. She added the correct units to her DEM! For some reason, not many students got this part right... but, who am I kidding? We excite easily :)
Brian's background is in IT and communications electronics in the Air Force.  His current job in Midland, TX is with a seismic exploration company in the oil and gas industry and the survey/mapping department. Welcome to the spotlight, Brian!


What we like: Good job of presenting environmental themed data in a single map.