Wednesday, February 27, 2013

GIS4043 Student Spotlight: Introduction to GIS- ArcGIS Online and Map Packages


GIS4043 Introduction to GIS, Instructor, Mrs. Amber Bloechle

ArcGIS Online and Map Packages


This week's lab continued our understanding and introduction of ArcMap and ArcCatalog. After creating an ESRI account, the Virtual Campus Course walked us through how to create a map package and share it through ArcGIS Online. Knowing how to share an original map file and accompanied data was an important skill learned this week.  This weeks deliverables included two map package screen shots and process summary.

Student Learning Outcomes:

  • Add ArcGIS Online basemaps and data from ArcMap
  • Use the Search tool in ArcMap to locate ArcGIS Online data
  • Create group layers
  • Display layers at certain scales
  • Create a custom map package
  • Recall when to create a map package or a tile package
  • Troubleshoot map package errors
  • Share a map package on the web

STUDENT SPOTLIGHT AWARDS

The following student was chosen for their exception work on the ArcGIS Online and Map Packages assignment:

Jacob Armbrust


About Jacob: Jacob is a UWF student who enjoys biology and traveling.  He has taught English abroad, worked as a teachers assistant here at UWF, and also studied abroad in Sweden and Brazil. When not hitting the books, Jake is at home on the water.  He is passionate about the ocean, scuba diving, and marine biology.  Welcome to the spot Jake - enjoy your time in the tank!

What we like: Jacob posted a great summary of this weeks lab and  went the extra mile by including links to his map packages and sharing his connection with the Yosemite Park data. Excellent job Jacob!


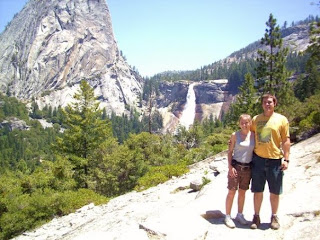
"I just uploaded my first map package to ArcGIS online for my Intro to GIS class. You can view it here. This file was created as a part of an ESRI online course that I took. The data shows areas in Yosemite National Park that are good for mountain climbing. This other file shows areas where samples were taken of trees. Below I have attached a photo of me and my wife at Yosemite. It is one of the most amazing National parks in the USA, do visit if you're in the area."

Tuesday, February 26, 2013

GIS3015 Cartographic Skills Student Spotlight- Introduction to Adobe Illustrator


GIS3015 Cartographic Skills, Instructor, Mrs. Trisha Holtzclaw

Introduction to Adobe Illustrator


In this weeks lab we were introduced to Adobe Illustrator and covered the main tools that will be utilized throughout the semester. The deliverables for this lab assignment included a map of Florida displaying both county and city layers in addition to the essential map elements.

Student Learning Outcomes:

  • Export a map from ArcGIS into Adobe Illustrator
  • Add/change basic  map elements in Adobe Illustrator
  • Examine the basic Adobe Illustrator tools
  • Organize layers and objects in Adobe Illustrator
  • Export map as .jpeg file from Adobe Illustrator

STUDENT SPOTLIGHT AWARDS

The following student was chosen for his exceptional work on the Introduction to Adobe Illustrator assignment:

Ryan Leath


About Ryan: Ryan is a 2010 graduate of Florida State Univeristy with a BS in Geography.  His future goals include a Masters in GIS 
and he is happy to be back in school after a short but eventful break.  Ryan currently lives in Orlando where he enjoys cooking and the great outdoors.  Great work Ryan - enjoy your time in the spotlight!

What we like: Ryan's map had a fantastic layout, design, and background color. He also included a unique border around his map to help personalize his work and make it his own. Great work Ryan!


"I spent some time earlier in the week just playing with the functions in AI. I made a couple different layers, drawing little designs on each of them and then playing with the visibility, lock and unlock, and pushing different layers to the top and bottom. I should have read through the beginning of the lab exercise though, I could not figure out the pencil and pen drawing tools for the life of me. I've got that down now.

As with all things in ArcGIS and AI, make sure to have the right layer selected. I was playing with the gradient mesh tool in my Neatline layer and everything was looking good until I wanted to take out the mesh appearance. I think I double clicked something because somehow I no longer had any layers selected. So after 10 minutes of frustration of not being able to get rid of the gradient mesh I figured out what was going on and fixed it.

I was also able to add a number of text sublayers to my Neatline layer by clicking on different parts of the artboard with my text tool still activated. Had to delete those little green spots one by one.

All in all though this was a very fun lab. I can not wait to load some of our other labs into AI and see what I can do. Making a sun and figuring out how to properly color with the gradient mesh would have made this map a lot better I think."

GIS4043 Student Spotlight: Introduction to GIS- GIS & Cartography


GIS4043 Introduction to GIS, Instructor, Mrs. Amber Bloechle

GIS & Cartography

This week we explored metadata in a bit more detail and also become better acquainted with data attributes and search queries. In addition to submitting the process summary the deliverables for this lab included 3 different maps focusing on areas, features, and the topography of Mexico.


Student Learning Outcomes:

  • Explore data files and data management tools in ArcCatalog
  • Work with and explore a Digital Elevation Model (DEM) raster file
  • Compare and contrast raster and vector data files
  • Edit an attribute table
  • Use Select by Attributes tools to select specific data
  • Create a new data layer from selection
  • Work with symbology tools to display data
  • Label specific data fields in a layer from the Label Properties dialog
  • Use the legend wizard to create a meaningful map legend
  • Further explore data layout options
  • Create a report that explains data being utilized in the GIS proejct (metadata), answers important questions and summarizes the process of creating exercises deliverables from beginning to end. 

STUDENT SPOTLIGHT AWARDS

The following student was chosen for his exceptional work on the GIS & Cartography assignment:

Adam Morrisette


About Adam: Adam is a history buff who is very interested in digital history and the humanities.  He is currently living in Bangor, Maine after living up and down the east coast. As a graduate student he participated in several terrestrial and underwater field schools. Adam has a MA in history and is very interested in GIS as a tool for historians.  I wonder if Adam will be joining the Archaeology track this summer....hmmm - looks promising. Welcome to the spotlight Adam - it's an elite group!

What we like: In addition to a flawless process summary, Adam made excellent choices regarding color scheme, labeling, and symbology. Adam displayed the data in a clear, easy to interpret manner, included all of the essential map elements, and payed close attention to detail, layout, and design.


"The first map created for our week three lab is a map of Mexican states by population.  The map uses a graduated color ramp of yellows, oranges, and browns to show the populations of each state.  I used a light gray for the other countries visible on the map as not to visually detract from Mexico."


"The second map shows railroads, federal highways, and rivers in central Mexico.  Urban centers with a population of more than one million are shown in red. I used a light, sandy background color for central Mexico so the railroads, river, and highways would really stand out. An inset maps shows the area of central Mexico depicted in the main map."


"The third map shows elevation in Mexico using a raster digital elevation model (DEM).  I used a color ramp composed of tans and browns to give the map an earthy appearance.  As with the first map, I used a light gray for the background color of other countries so they did not detract from the focus on Mexico.  Again, an inset map shows the area depicted in the main map."

Tuesday, February 19, 2013

GIS3015 Cartographic Skills Student Spotlight- Data Classification


GIS3015 Cartographic Skills, Instructor, Mrs. Trisha Holtzclaw

Data Classification


In this lab we compared and demonstrated the four methods of classification generally used for mapping using census data for Escambia County. We utilized ArcGIS to prepare a map with four data frames and reviewed the process to manually change class breaks in ArcGIS.

Student Learning Outcomes:

  • Analyze the different methods of data classification.
  • Compare the basic principles of symbolization (choropleth, proportional, isopleth, and dot)
  • Determine which statistic, graph, or data classification method will be best for a given data set.
  • Determine the appropriate symbolization

STUDENT SPOTLIGHT AWARDS

The following student was chosen for her exceptional work on the Data Classification assignment:

Robyn Frelich 


About Name: Robyn works as a GIS Analyst in Tampa and lives in Plant City, Florida - the Winter Strawberry Captital. She spends most of her day working with engineers on transportation planning issues. Outside of work, Robyn spends most of time with her young daughter and step-son. Hmmm... wonder if she has plans to take them to the Florida Strawberry Festival that starts on the 28th? Welcome to the limelight - enjoy your stay!

What we like: Robyn utilized the entire map area to show her work in a visually pleasing manner. She also had great map design and layout.

"In addition to creating a map with the four different classification types, we were asked to create one map using the data classification that best shows the data. I chose the Natural Break data classification. This classification type in my opinion allocated the data into classes that made the most sense for what we were showing."

Wednesday, February 13, 2013

GIS3015 Cartographic Skills Student Spotlight- Statistical Foundation

GIS3015 Cartographic Skills, Instructor, Mrs. Trisha Holtzclaw

Statistical Foundation


In this lab, we used Excel to perform some basic statistical functions with population data like: Standard Statistics, Histograms, and Graphing of statistics.  Deliverables include posting one histogram or scatterplot graph created during this lab to the blog.

Student Learning Outcomes:

  • Demonstrate the basic concepts of statistical software and analysis.
  • Calculate standard statistics such as: mean, median, mode, variance, and standard deviation
  • Diagram the distribution and skewness of data utilizing histograms
  • Determine linear and polynomial trendlines for data arrays.

STUDENT SPOTLIGHT AWARDS

The following student has been chosen for her exceptional work on the Statistical Foundation assignment:

Ellen Markin 


My Photo
About Ellen Markin: Ho'omaika'i 'ana  (Congratulations) Ellen! Ellen works as a GIS Specialist with a cultural resource management firm in Reno, Nevada. She has a BA in Anthropology from the University of Hawaii-Hilo and completed graduate courses in GIS and Geography from the University of Montana. Ellen spends a lot of her time working in GIS and feels very lucky to have a job that combines her interest in archaeology and GIS.  Welcome to the spotlight, Ellen - job well done!

What we like: We liked that ALL of Ms. Markin's values were correct. The level of detail she exhibited with her graphs and process summary were also superb!


"This is one of the histogram from the Cartography week 2 lab. In this version Excel set the default bin size of 19.25. The results are very similar to the histogram I created with a bin of 20".

"When calculating the polynomial trendlines Excel returned two of the equations with numbers in scientific notation. This caused me some confusion. When I calculated the populations for 2050 the numbers came out strange, one ended up being negative. It turns out that by keeping the scientific notation Excel was rounding the numbers. I changed the formula on the chart to number format to get the correct numbers and used those in my calculations. They returned much more reasonable population estimates".


Monday, February 4, 2013

GIS4043 Student Spotlight: Introduction to GIS- Own Your Map Lab Assignment


GIS4043 Introduction to GIS, Instructor, Mrs. Amber Bloechle


Own Your Map

In this week's lab we took a look at the essential map elements in ArcGIS and learned how to use associated tools available in ArcMap. The main purpose of the lab was to provide a step-by-step guide for creating quality maps in this course and program. A secondary purpose was to provide the basics required to create your own mapping style- hence, the title.

Student Learning Outcomes:

  • Identify and implement the essential elements of map making
  • Locate and execute commonly used tools in ArcGIS for viewing, creating and exporting maps
  • Differentiate Layout View and Data View in ArcGIS/ArcMap
  • Create a personalized map template in ArcGIS/ArcMap to standardize map design
  • Export a final MXD map to JPEG format from ArcGIS/ArcMap

STUDENT SPOTLIGHT AWARDS

The following student was chosen for his exceptional work on the Own Your Map assignment.


David Hunt 


My Photo
About: Dave is a recent graduate of the UWF Maritime Studies Program and an alumnus of University of Washington and Seattle Pacific University. He's also an accomplished computer programmer and owner of software firm.  
Dave describes his most memorable learning experience as archaeology field school in SE Oregon in summer 2012, where he spent six weeks in the high-desert excavating a site that reaches back at least 10,000 years. Wow! That sounds very exciting and a possible GIS project in the future.
Welcome to the first GIS Spotlight, Dave. We hope you enjoy your time in the light!

What we like: Dave's map contains all the essential elements required and is presented in a clean, easy-to-read layout. There is a good use of "white-space", none of the supplementary information is drawing undue attention, the scale bar is set to a nice round number, and the color scheme is logical. Great work, Dave!